 US Freight Shipments Plunge at Fastest Rate since 2009, Hit 2011 Level: Getting Ugly
US Freight Shipments Plunge at Fastest Rate since 2009, Hit 2011 Level: This is Getting Surprisingly Ugly
by Wolf Richter Jan 15, 2020
Why is this happening?
By Wolf Richter
Shipment volume in the US by truck, rail, air, and barge plunged 7.9% in December 2019 compared to a year earlier, according to the Cass Freight Index for Shipments. It was the 13th month in a row of year-over-year declines, and the steepest year-over-year decline since November 2009, during the Financial Crisis:
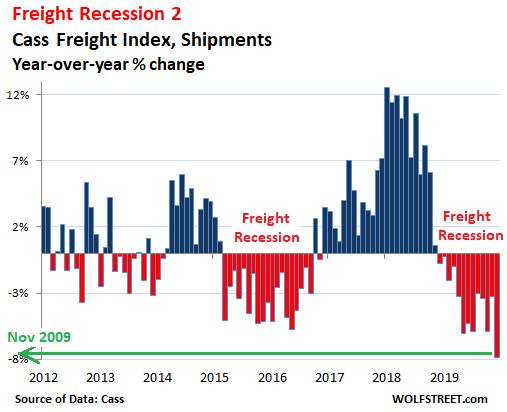
The Cass Freight Index tracks shipment volume of consumer goods and industrial products and supplies by all modes of transportation, but it does not track bulk commodities, such as grains. As always when things get ugly, the calendar gets blamed Christmas fell on a Wednesday, as it does regularly.
More realistically, December was also the month when Celadon Group, with about 3,000 drivers and about 2,700 tractors, filed for Chapter 11 bankruptcy and ceased operations the largest truckload carrier ever to file for bankruptcy in US history. It rounded off a large wave of bankruptcies and shutdowns of trucking companies in 2019, most of them smaller ones, but also some regional carriers, and on December 9, Celadon.
Rail traffic in December capped off a miserable year, with carloads down 9.2% year-over-year in December, and container and trailer loads (intermodal) down 9.6%, according to the Association of American Railroads. For the 52-week period, traffic of carloads and intermodal units fell 5%.
The 7.9% year-over-year drop of the Cass Freight Index pushed it below a slew of prior Decembers, including December 2011. The top black line represents 2018, the fat red line 2019:
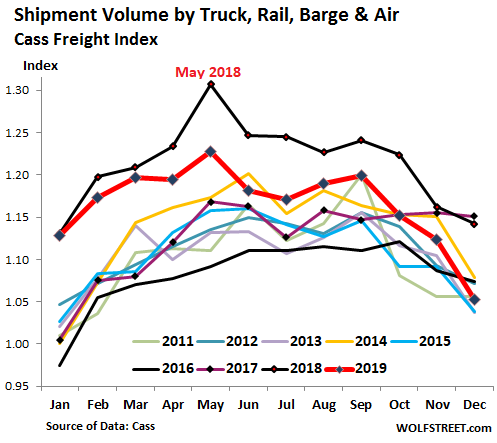
Cass derives the data from actual freight invoices paid on behalf of its clients ($28 billion in 2018). So this data is not based on sentiment surveys. Its based on a large sample of the actual shipments in the US, involving real money, sent by numerous companies across many sectors.
The shipment boom in 2018 was a sight to behold. It had been fired up by widespread efforts to front-run the tariffs by loading up on merchandise. So some backtracking was to be expected. But not this plunge in shipments to multi-year lows.
Freight expenditures fall, but remain high.
In 2018, shippers such as industrial companies or retailers or manufacturers groaned under the surging freight expenditures and complained about it in their earnings reports. Total freight expenditures paid by shippers are a mix of freight rates, including fuel surcharges, and the volume of shipments. Some freight rates have remained high, and some companies such as UPS and FedEx have raised their rates, despite this environment of falling shipment volume. Other freight rates have come down under pressure, particularly in the trucking spot market. And for months, even as shipment volume was dropping, the total amount that shippers paid remained stubbornly high. But now this is starting to change.
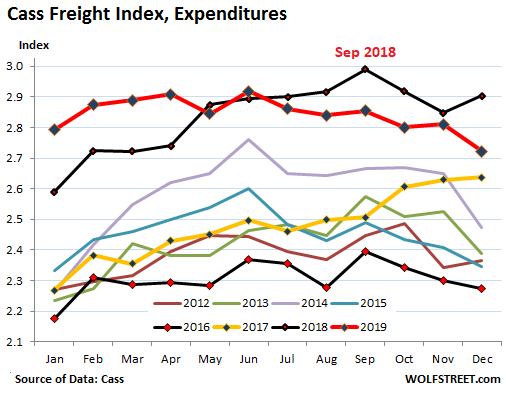
In December, total freight expenditures the amount shippers, such as manufacturers, retailers, or industrial companies, spent on freight by all modes of transportation dropped 6.2% from a year ago.
Thats a steep drop, but expenditures are still dropping more slowly than shipment volume, indicating that there are pockets FedEx, UPS, etc. where freight rates continue to rise, and this leaves the Cass Freight Index for expenditures in December at still high levels, though dropping sharply (2019 = fat red line). Note the yellow line (2017) and the top black line (2018), as an indicator of how much freight expenditures surged in those two years:
What is causing this sharp decline in shipments?
Retail sales, powered by ecommerce, are holding up. Ecommerce is red-hot and brick-and-mortar retail is dismal. December data has not emerged yet, but in November total retail sales, including ecommerce, rose 3.1% year-over-year.
Total construction spending has bounced off in recent months from lower levels. In November, it grew at an annual rate of 4.1% year-over-year, but remains below the peak of February 2018.
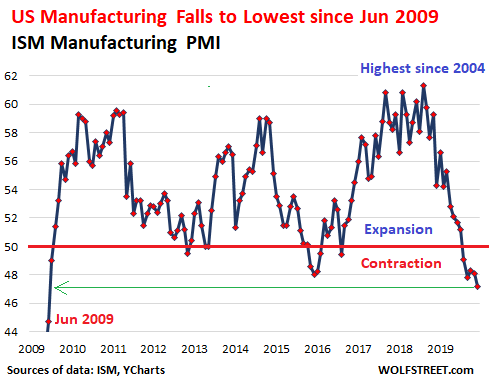
But manufacturing is weak and getting weaker. One of the data points on this theme and there are many others: The ISM Purchasing Managers Index for December dropped 0.9 percentage points from November to 47.2%, the fifth month in a row of contraction, and the fastest contraction since June 2009, with employment, new orders, new export orders, production, backlog of orders, and inventories all contracting:
The Oil-and-Gas-Bust.
The oil-and-gas sector is now undergoing phase 2 of the bust that started in mid-2014. The price of oil is still down by nearly half from where it was then. The price of natural gas remains in total collapse mode. And the cashflow-negative fracking industry is getting morose, trying to curtail the bleeding, by cutting investments, cutting purchases, cutting employment, trying to persuade investors that they should send even more money their way.
https://wolfstreet.com/2020/01/15/us...it-2011-level/
The trouble with socialism is that you eventually run out of other people's money. - Margaret Thatcher


 Reply With Quote