 Plunge of Retail Inventories, Collapse of New & Used Vehicle Inventories: Shortages
Plunge of Retail Inventories, Collapse of New & Used Vehicle Inventories: The Shortages Depicted in Charts
by Wolf Richter Jul 18, 2021
Inventories at retailers document this mess.
By Wolf Richter for WOLF STREET.
Turns out, when the US government spends $5 trillion in borrowed fiscal stimulus over 16 months, and the Fed hands out $4 trillion in monetary stimulus over the same period, causing asset prices to boom, demand for goods is going to wash over the land in tsunami-like waves, and supply chains that snake all over the world, amid finely honed just-in-time-inventory strategies, get tangled up. And as retail sales spiked in a historic manner, shortages of all kinds have been cropping up, including the semiconductor shortage that has slammed the auto industry with a vengeance.
Inventories at retailers document this mess. Inventories are tight all around, but theyre in catastrophic condition at auto dealers, which before the pandemic accounted for over one-third of total retail inventories.
Inventories at new vehicle dealers, used vehicle dealers, and parts dealers fell to $153 billion in May, down 36% from May 2019, according to data released by the Census Bureau on Friday. And the inventory-sales ratio with inventories and sales both in dollars, the impact of inflation gets canceled out dropped to 1.14, the lowest level in the data going back to 1992:
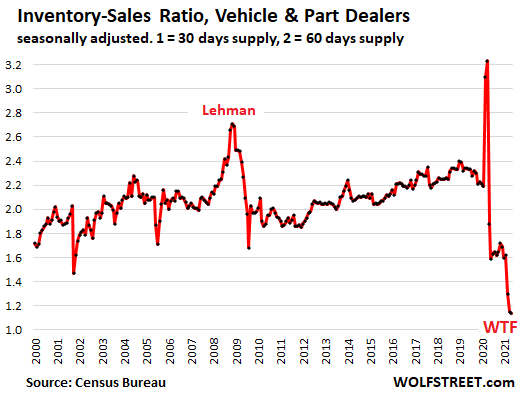
The inventory-sales ratio (inventories divided by sales) is a standard metric in the retail industry. A ratio of 1 means that the retailer has enough goods in inventory for one month of sales at the current rate of sales. This would be 30 days supply. A ratio of 2 meaning 60 days supply is considered healthy in the auto industry.
In dollar terms: The ever-more expensive vehicles in inventory over the years explain all of the long-term rise of inventories in the chart below. Unit retail sales and unit inventories with them have had huge cyclical swings, up and down, over the past 20 years and went nowhere. In 2019, new-vehicle unit sales were at 1999 and 2000 levels, with just over 17 million vehicles sold, followed by a plunge in 2020 to the 1978 level.
In unit sales, the industry has stagnated for two decades. And inventories in units paralleled this stagnation. What changed were the prices of vehicles.
Dealers book vehicles into inventory at cost (invoice), not at retail price. But MSRP gives us an indication of what happened to dealer cost: the MSRP of the F-150 XLT, the bestselling truck in the US, rose by 80% from the 2000 model year ($19,410) to the 2021 model year ($35,050). And the MSRP of the Camry LE, the bestselling car in the US, rose by 22% over the same period, from $20,388 to $24,970 (the WOLF STREET Pickup Truck and Car Price Index).
In addition, there has been a large-scale structural shift away from less costly cars to more expensive SUVs and trucks, which further ballooned the dollars tied up in inventory, without increasing units in inventory.
It is with this surge in per-unit costs in mind that we look at long-term inventory levels in dollar terms. And this makes the 36% plunge in total vehicle and parts inventories, from $240 billion in May 2019 to $153 billion in May 2021 that much more brutal given the shift to more expensive units over the period:
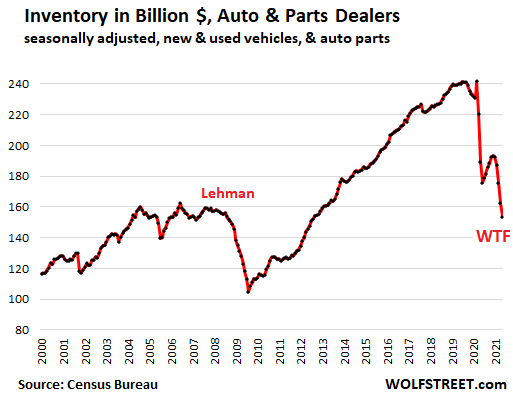
During the Financial Crisis, there also was a plunge in inventories, but it was accompanied by a collapse in vehicle sales that caused GM, Chrysler, and a slew of component makers to file for bankruptcy protection.
This time around, fueled by stimulus, there has been strong retail demand for vehicles in March, April, and May, and it was only in June, with inventories depleted and prices sky-high, that sales fell sharply and were down 14% from June 2019. But the current inventory data is only for the end of May, which was the base for what was available for sale in early June.
Total inventories at all retailers, from auto dealers to supermarkets, fell to $598 billion in May, seasonally adjusted, down 9.8% from May 2019, the third month in a row of declines, but still up from the low in June last year. These inventories in May, and retail sales in May which had declined from April produced the second lowest inventory-sales ratio in the history of the data going back to 1992, the lowest having been in April:
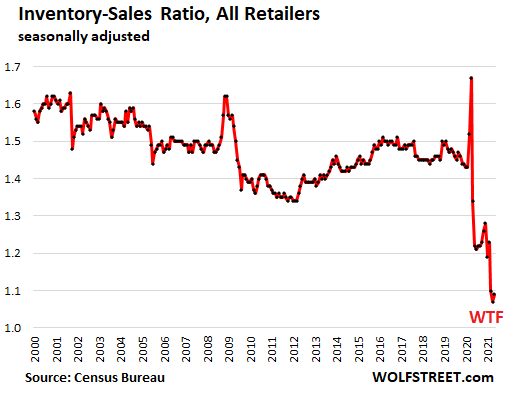
The spikes in the chart above occurred when retail sales suddenly plunged after the Lehman bankruptcy and in March and April 2020.
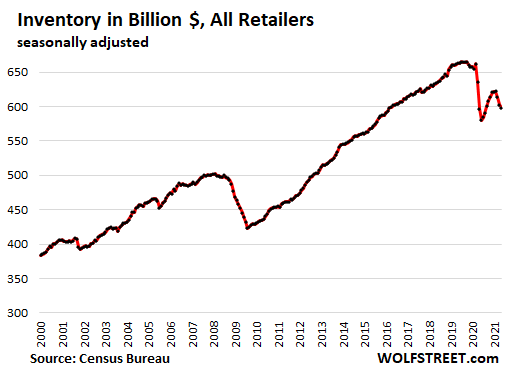
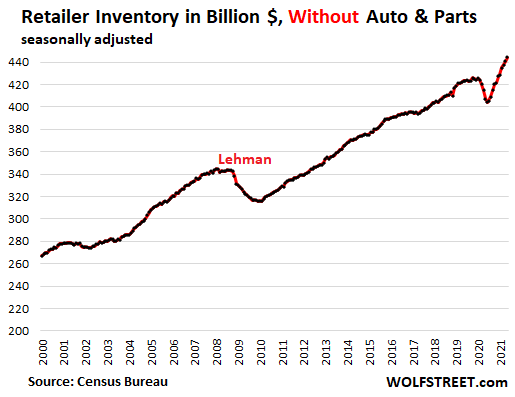
In dollar terms: Price increases of goods in inventory over the years explain part of the long-term rise of inventories in the chart below. Note that the decline in inventories over the past few months comes despite rampant cost increases (and price increases), as the stimulus-fueled retail boom drained inventories:
Inventories without auto and parts dealers, in dollar terms are back on expansion track, having reached a new all-time high of $444 billion in May, which shows to just what extent new and used vehicle inventories have plunged, while most other retailers have gotten a better grip on their inventories, with shortages in some products, and more than plentiful supply in other products:
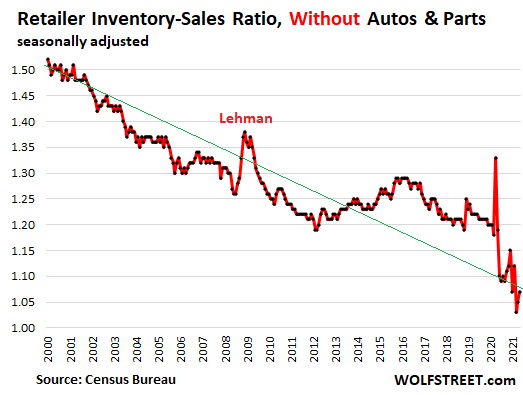
But increased costs of items in inventory cover up part of the tightness; and given the surge in retail sales compared to pre-pandemic years, the inventory-sales ratio, though it has ticked up for the second month in a row, remains near its all-time record low. Note the long-term trend (green line) of two decades of lean-inventory strategies and the shift to ecommerce with its inventory efficiencies (centralized warehousing):
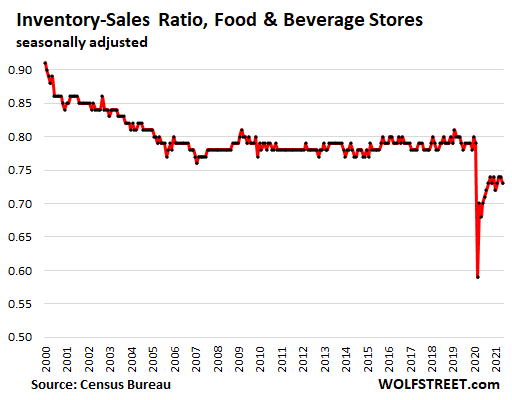
Inventories at food and beverage stores, after the empty-shelves spring last year, have recovered overall and edged up to a new record of $54.4 billion in May.
Because sales at these stores were about 15% higher than theyd been before the pandemic, they pushed down the inventory-sales ratio to 0.73, compared to the multi-year average before the pandemic of 0.78. Food and beverage stores are increasing their dollar inventory overall, but are turning it even more quickly, giving rise to sporadic and brief shortages in a few items here and there.
https://wolfstreet.com/2021/07/18/pl...e-inventories/
The trouble with socialism is that you eventually run out of other people's money. - Margaret Thatcher


 Reply With Quote